RSI is a momentum indicator that measures the speed and change of price in recent times that evaluates a condition of a stock or an asset whether it is overbought or oversold.
RSI is displayed as an oscillator as a line graph moves between two extreme points which has a reading of about 0 to 100.
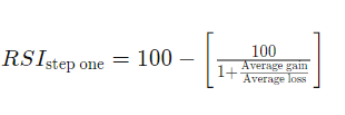
How is it Formulated or Calculated?
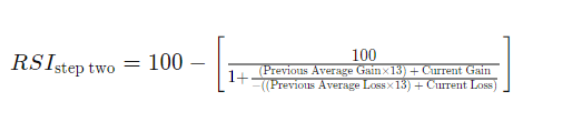
RSI has a formula with two steps as a standard period days as 14 days.
Once there are 14 periods of data available, the second part of the RSI formula can be calculated. The second step of the calculation produces results.
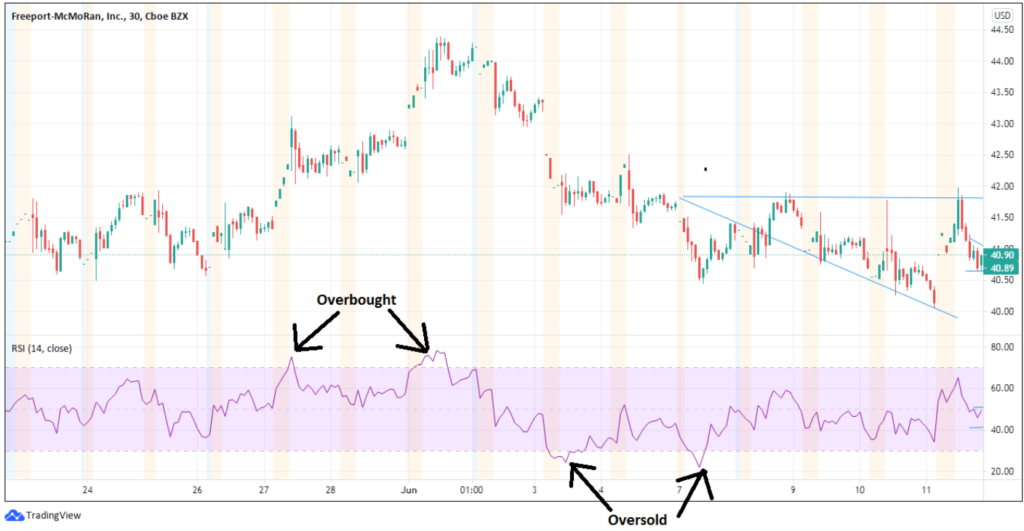
How is it used in financial analysis?
Overbought and Oversold condition says about the trend of an asset whether it is bullish or bearish. The RSI indicator graph is used under the price chart and it 30% indicates asset is oversold and 70% indicates overbought.
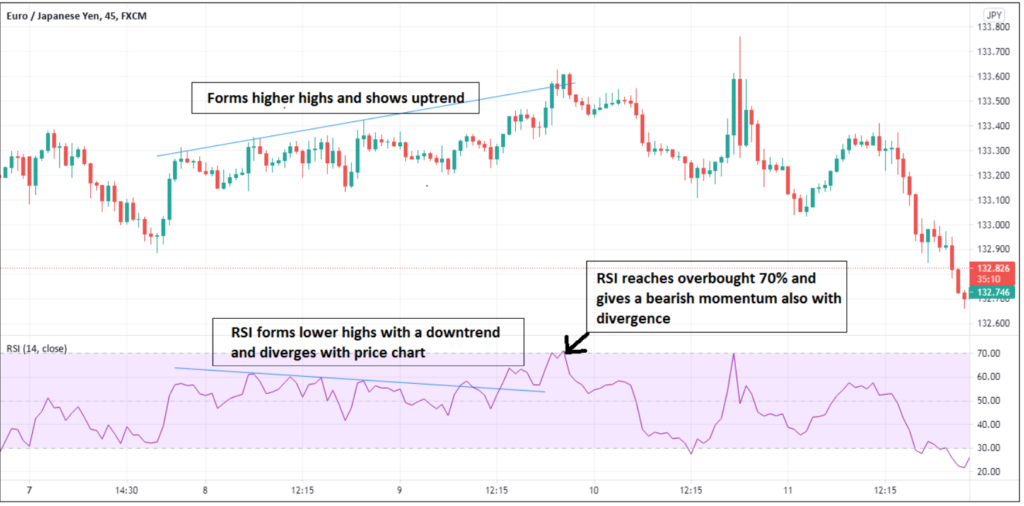
Impact on a stock any example?
When the trend of a price chart and RSI lines with respect to price chart diverges there is likely to be a trend reversal. Sometimes as an added confirmation RSI gives overbought or oversold signal.
1) What is the Volume Weighted Average Price (VWAP)? The volume weighted average price (VWAP) is a tradingbenchmark used by traders that gives the average price a
1) Define Moving average convergence divergence (MACD). Moving average convergence divergence (MACD) is a trend-following momentum indicator that shows the relationship between two moving averages of a stock’s price. MACD
Intro to Key levels 1) Describe Key Level. In trading charts, Support and Resistance acts more significant for technical analysis and gives a strong confirmation