1) What is the Volume Weighted Average Price (VWAP)?
The volume weighted average price (VWAP) is a tradingbenchmark used by traders that gives the average price a stock has traded at throughout the day, based on both volume and price.
Retail and professional traders use the VWAP as part of their trading rules for determining intraday trends.
VWAP is purely an intraday indicator that it gives validation for a single day.
2) Calculation:
VWAP is calculated by adding up the dollars traded for every transaction; price
multiplied by the number of shares traded and then dividing by the total shares traded.
3) What does VWAP says?
VWAP gives the value of the value of a stock along with its trend for the day.
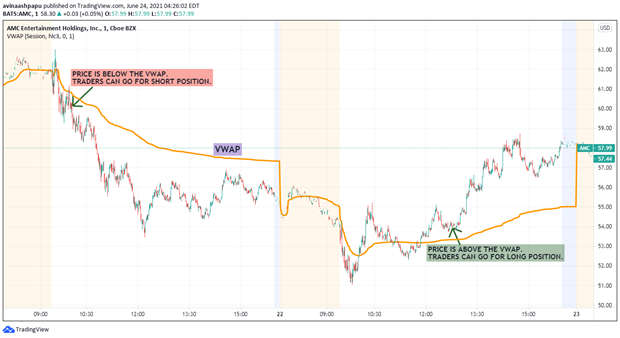
The volume weighted average price (VWAP) appears as a single line on intraday charts (1 minute, 15 minute, and so on), similar to how a moving average looks.
When the price is above VWAP they may prefer to initiate long positions. When the price is below VWAP they may prefer to initiate short positions.
4) VWAP and EMA correlation (Example of a stock chart with crossover)
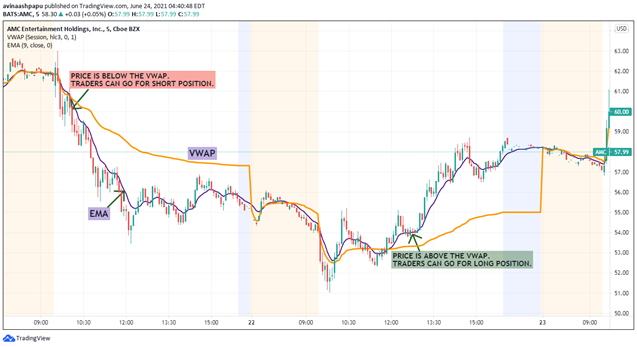
EMA is a moving average that inputs more weight on the recent price points and gives a sign of trend is bullish or bearish.
Since VWAP is an intraday indicator its correlation with EMA gives higher probability for traders to take market decisions – to go for a long or short position.
While VWAP gives volume related movement, EMA trend line crossover with VWAP indicates a change in momentum of the price trend.
Here it’s clearly seen, when EMA is below the VWAP it’s a bearish trend and after its crossover (EMA above VWAP) with respect to change in volume and price difference in recent lower time periods it gives a bullish trend.
1) What is the Volume Weighted Average Price (VWAP)? The volume weighted average price (VWAP) is a tradingbenchmark used by traders that gives the average price a
1) Define Moving average convergence divergence (MACD). Moving average convergence divergence (MACD) is a trend-following momentum indicator that shows the relationship between two moving averages of a stock’s price. MACD
Intro to Key levels 1) Describe Key Level. In trading charts, Support and Resistance acts more significant for technical analysis and gives a strong confirmation