1) DEFINITION:
BOLLINGER BANDS:
It is a technical analysis indicator or a tool that gives a higher probability of a stock or any other asset is overbought or oversold.
2) How it’s viewed in chart?
Along with SMA a set of two trend lines are plotted above and below the SMA. This trend lines are with two standard deviations both positive and negative.
All the SMA and two standard deviation trend lines compose a Bollinger bands.
3) Working of Bollinger Bands:
Traders believe the closer the prices move to the upper band, the more overbought the market, and the closer the prices move to the lower band, the more oversold the market.
In short, Bands determine the volatility. Wider the bands higher the volatility and when the bands contract the volatility is low which also indicates volatility is going to be higher soon.
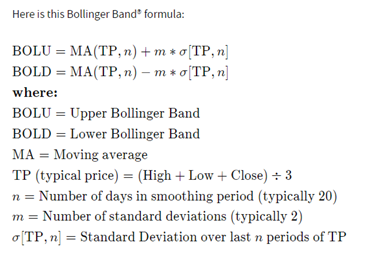
4) Calculation:
The first step in calculating Bollinger Bands® is to compute the simple moving average of the security in question, typically using a 20-day SMA. A 20-day moving average would average out the closing prices for the first 20 days as the first data point.
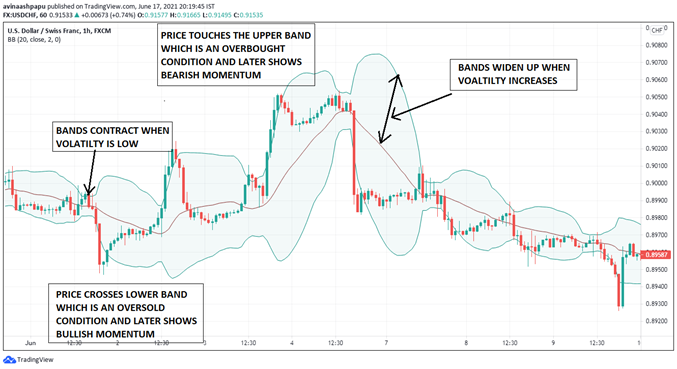
5) Example for Bollinger Band in a price chart:
When price touches upper band and lower band it’s a sign of overbought and oversold respectively.
Bollinger Bands are all about volatility. If bands comes closer it indicates a less volatility in the market whereas bands widen up it shows a high volatility.