VIX – CBOE Volatility Index
1) What Is the Cboe Volatility Index (VIX)? VIX is a real time index of S&P 500 index (SPX) that represents the market participants sentiment
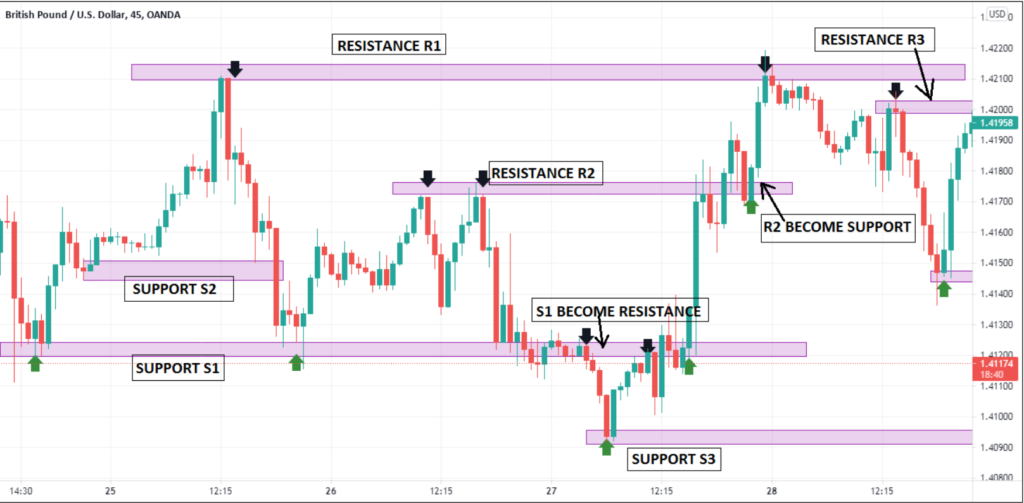
1) Describe Key Level.
2) Significance of Key Levels.
3) Example for Key Levels.
1) What Is the Cboe Volatility Index (VIX)? VIX is a real time index of S&P 500 index (SPX) that represents the market participants sentiment
1) DEFINITION: BOLLINGER BANDS: It is a technical analysis indicator or a tool that gives a higher probability of a stock or
1) What is the Volume Weighted Average Price (VWAP)? The volume weighted average price (VWAP) is a tradingbenchmark used by traders that gives the average price a
1) Define Moving average convergence divergence (MACD). Moving average convergence divergence (MACD) is a trend-following momentum indicator that shows the relationship between two moving averages of a stock’s price. MACD
Relative Strength Index What is it? Or Define? Relative Strength Index (RSI) RSI is a momentum indicator that measures the speed and change of
Intro to Key levels 1) Describe Key Level. In trading charts, Support and Resistance acts more significant for technical analysis and gives a strong confirmation