Moving Averages
- What is it? Or Define?
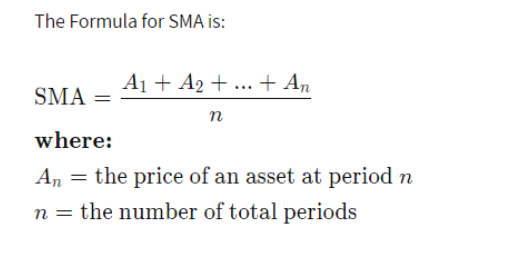
SIMPLE MOVING AVERAGE (SMA)
A Simple Moving Average (SMA) calculates the average (mean) of the range of prices (closing price), by the number of periods in that range.
EXPONENTIAL MOVING AVERAGE (EMA)
An Exponential Moving Average (EMA) gives higher weight to the recent prices while SMA gives equal weight to all the values.
EMA has a way more sensitive reaction when compared to the SMA as EMA gives more weight on recent prices.
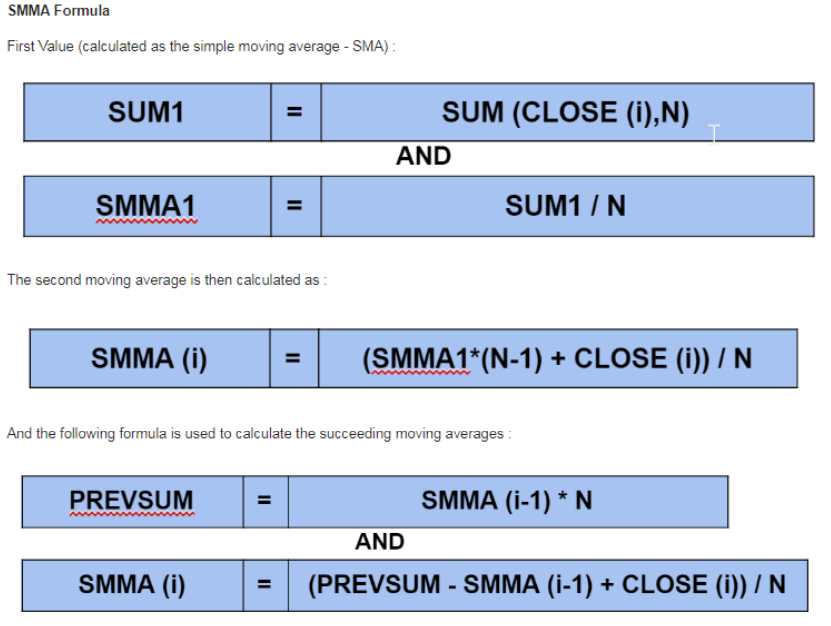
SMOOTHED MOVING AVERAGE (EMA)
The Smoothed Moving Average uses a longer period to determine the average, assigning a weight to the price data as the average is calculated. Thus, the oldest price data in the Smoothed Moving Average are never removed, but they have only a minimal impact on the Moving Average.
- How is it Formulated or Calculated?
SIMPLE MOVING AVERAGE (SMA)
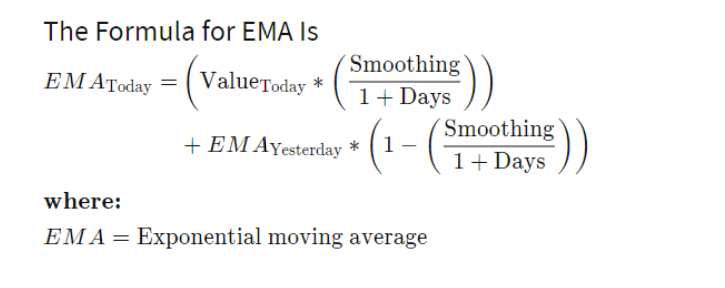
EXPONENTIAL MOVING AVERAGE (EMA)
To calculate the multiplier for smoothing (weighting) the EMA, this typically follows the formula: [2 ÷ (number of observations + 1)]
To calculate current EMA
EMA = Closing price x multiplier + EMA (previous day) x (1-multiplier)
SMOOTHED MOVING AVERAGE (EMA)
- How is it used in financial analysis?
Moving averages gives sell and buy signal. If the moving average is below the assets price it ensures and uptrend and if the moving average is above the assets price its likely to be a downtrend.
- Impact on a stock any example?
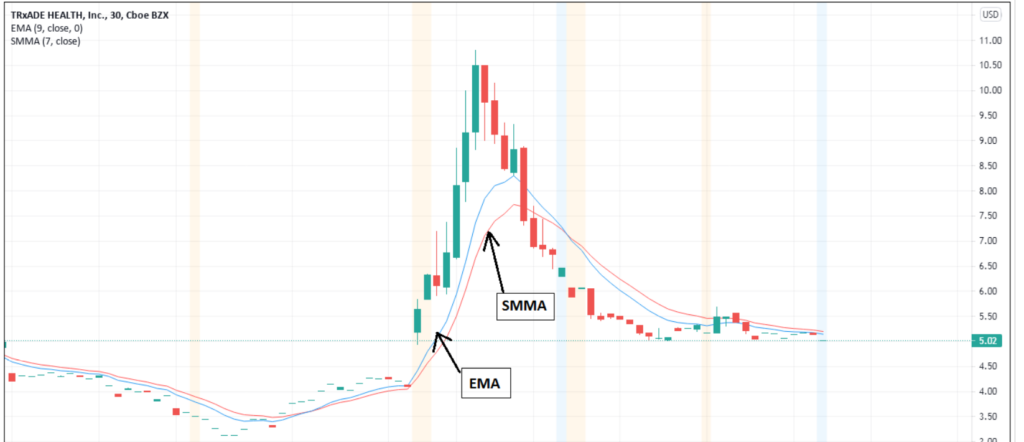
EMA moves significantly than other moving averages. It’s shown in the chart below. EMA has more weight on its recent price ranges and its impact is seen with SMMA movement which has relatively low impact movement.
As the moving averages are below the price its showing an uptrend and as moving averages crosses over the price and goes above assets price it shows an downtrend.